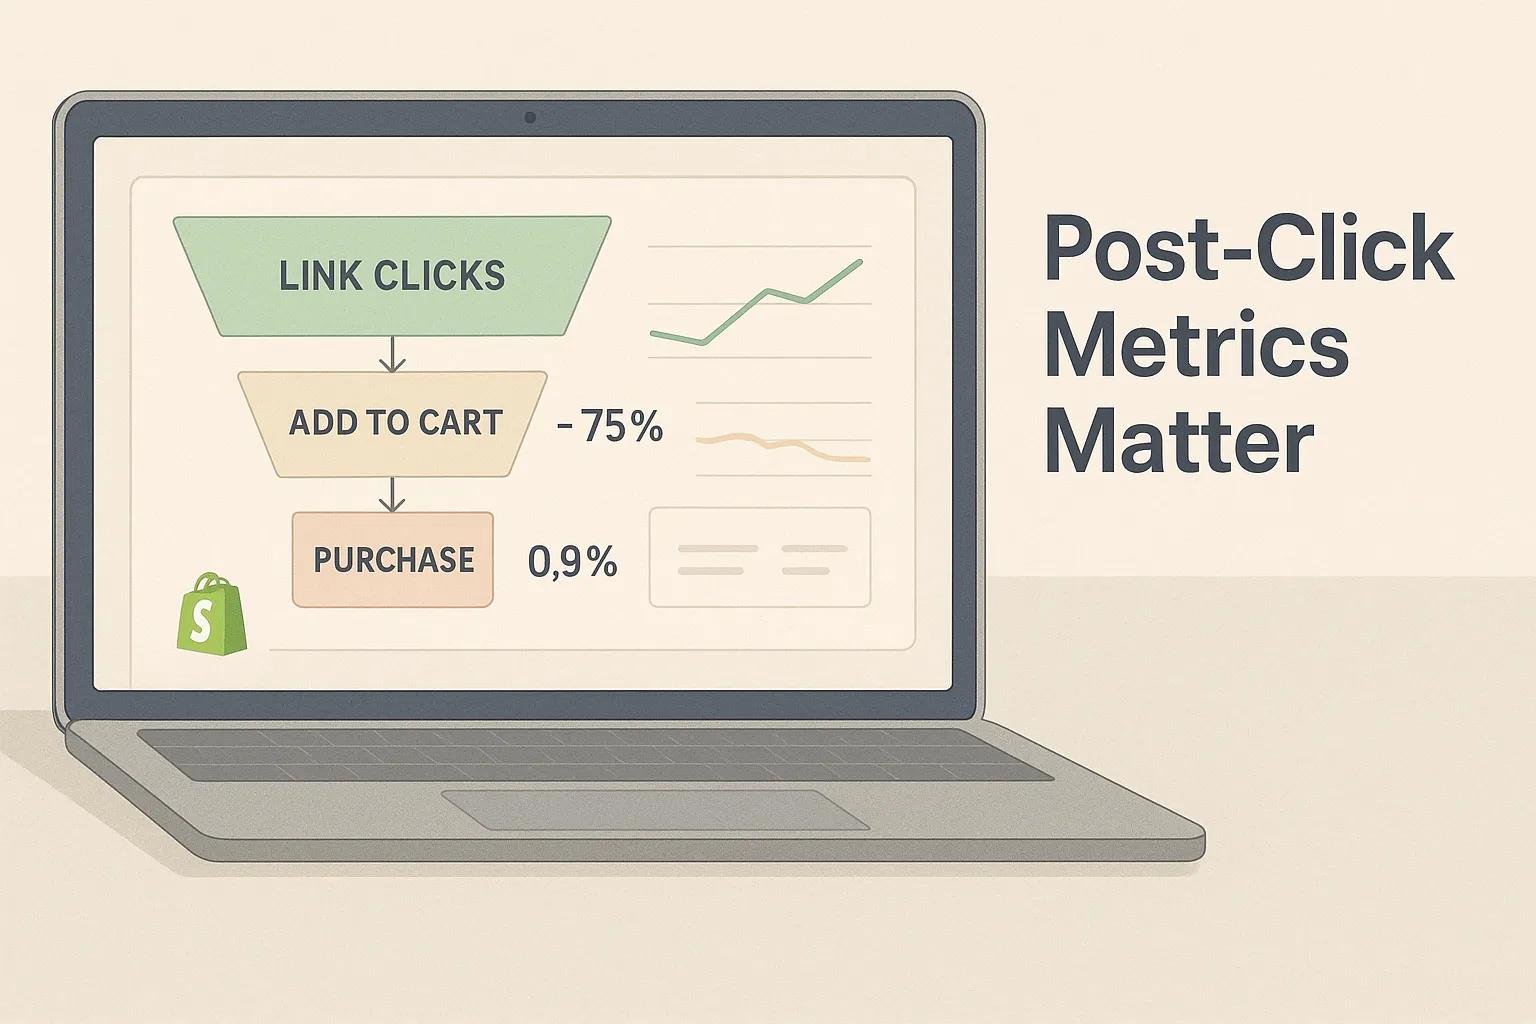
It’s Not the Ads. It’s What You’re Ignoring After the Click.
If your Shopify ads are underperforming, the issue usually isn’t the creative or the targeting. It’s that you’re tracking the wrong stuff or reacting too slowly to what’s actually happening.
You can’t optimize what you don’t understand. This post breaks down exactly what to measure and what each number is really telling you.
Stop Chasing Likes. Start Watching Buyer Behavior.
Clicks don’t equal conversions. And ROAS isn’t enough to evaluate ad performance.
Here’s what actually matters:
- What happens after the click
- Whether your store converts cold traffic
- How people move (or don’t move) through your funnel
Related: Tracking the Right Metrics in Paid Funnels
1: Landing Page View Rate (Not Just Link Clicks)

Platforms like Meta report “link clicks” but that includes accidental taps, Facebook canvas loads, and clicks that never made it to your store.
What you actually want to track: Landing Page Views (LPVs) inside Facebook Ads Manager or Google Analytics.
If your LPVs / Clicks < 75%, your ad is too slow or your audience is low intent.
Fix:
- Optimize page speed
- Use better ad copy that qualifies the click
- Test new audience layers
2: Add-to-Cart Rate
This is your first real buying intent signal.
Industry baseline: 2–5% Add-to-Cart rate is considered average.
If yours is lower:
- Your offer might not be compelling
- Product-market fit might be off
- You’re showing the wrong product first
Related: One-Page Store Design That Converts on Mobile
Fix:
- Reorder homepage or collection to feature high-converting SKUs
- Use urgency/clarity near the CTA (e.g. “Only 3 Left” or “Free Shipping Over $50”)
- Recheck your product images (especially on mobile)
3: Checkout Initiation Rate

Plenty of stores get carts. Few get checkouts.
This usually points to:
- Surprise costs (shipping, tax)
- Weak trust signals
- Confusing layout or too many steps
Baseline: 60–70% of carts should reach checkout.
If you’re under that, audit your:
- Cart UX
- Payment options
- Pop-ups or distractions near CTA
Related: Fix This in Your Product Listings to Rank Better
4: Purchase Conversion Rate
This is the bottom-line metric: How many landing page visitors turn into buyers?
Industry baseline for cold traffic: 1.5%–3% is solid. Under 1%? Something’s broken.
Look at:
- Product-market-message alignment
- Buyer objections (return policy? sizing? shipping delays?)
- Post-click consistency (does the landing page match the ad?)
Tip: Use heatmaps (Hotjar, Microsoft Clarity) to see where people stop scrolling.
Related: Homepage Copy That Doesn’t Waste Space
5: Bounce Rate on Ad Traffic

If visitors leave in <5 seconds, they didn’t even consider buying.
High bounce usually means:
- Slow mobile speed
- Too much text
- Irrelevant landing page vs ad promise
- Pop-ups that fire too early
What to aim for: <55% bounce rate on cold ad traffic.
Related: Website Layouts That Are Working in 2025
6: Session Duration and Scroll Depth
These tell you how far buyers are making it not just whether they clicked.
Short session (under 20 sec): No serious intent Scroll depth <50%: Page is too long or misprioritized
Fix:
- Move your “Add to Cart” button above the fold
- Add icon-based benefits before deep copy
- Test shorter vs longer pages
Related: A Smarter Way to Use CTAs in Blogs
7: Cost Per Add-to-Cart
Your CPA (Cost Per Acquisition) isn’t the only number that matters.
Cost Per Add-to-Cart (CPATC) gives you insight earlier in the funnel.
Track this alongside ROAS. If you’re getting adds to cart for <$5 but no sales, your checkout or product trust is broken not your ad.
Use this metric to diagnose where things fall apart.
8: Returning Visitors from Ad Campaigns
Most purchases don’t happen on the first visit especially with cold traffic.
Use UTM tags and GA4 to track how many returning visitors came from paid.
A healthy funnel retargets these users. If your retargeting pool is small or conversions are still low:
- You’re not memorable
- Your remarketing ad offer is weak
- You’re not using email/SMS to follow up
Related: Funnels That Convert With Fewer Steps
Conclusion: Your Ads Aren’t Dead. Your Funnel’s Unclear.
When ads flop, most store owners panic and rebuild creatives or target new audiences.
But in reality? Your funnel’s breaking down post-click.
Here’s what to check:
- Landing Page Views vs Clicks
- Add-to-Cart %
- Checkout Initiation %
- Bounce Rate
- Session Time + Scroll
- Cost Per Add-to-Cart
- Returning Visitor Ratio
The more you zoom in on these, the faster you’ll stop guessing and start fixing.

Custom video production at scale
Aneeverse covers all video needs whether you're telling your brand story, launching a product or running ads. Discover how we can help you scale.
Frequently Asked Questions
Depends on margins. For low-ticket items, 2.5–3x is healthy. For high-margin products, even 1.5x might work.
